ランダム要素を取得する#
import numpy as np
np.random.seed(42)
import matplotlib.pyplot as plt
[0, 1]範囲でのランダムな要素を取得する#
np.random.random()は[0, 1]の範囲のランダムな要素を1つ返す#
a = np.random.random()
a
0.3745401188473625
np.random.rand()は[0, 1]の範囲のランダムな要素を指定した形式で返す#
a = np.random.rand(3, 4)

def info(array):
    print('array: ', array)
    print('shape: ', array.shape)
    print('size: ', array.size)
    print('mean: ', array.mean())
    print('sum: ', array.sum())

info(a)
array:  [[0.95071431 0.73199394 0.59865848 0.15601864]
 [0.15599452 0.05808361 0.86617615 0.60111501]
 [0.70807258 0.02058449 0.96990985 0.83244264]]
shape:  (3, 4)
size:  12
mean:  0.5541470189948003
sum:  6.649764227937604
整数値の場合#
a = np.random.randint(low=0, high=10, size=(4, 5))
info(a)
array:  [[5 1 4 0 9]
 [5 8 0 9 2]
 [6 3 8 2 4]
 [2 6 4 8 6]]
shape:  (4, 5)
size:  20
mean:  4.6
sum:  92
### 予め指定した配列から重複を許して選ぶ場合
number_list = np.arange(0, 10, 2)
print(f'number_list: {number_list}')
chosed_number = np.random.choice(number_list, size=10)

info(chosed_number)
number_list: [0 2 4 6 8]
array:  [2 6 0 6 2 2 0 2 8 2]
shape:  (10,)
size:  10
mean:  3.0
sum:  30
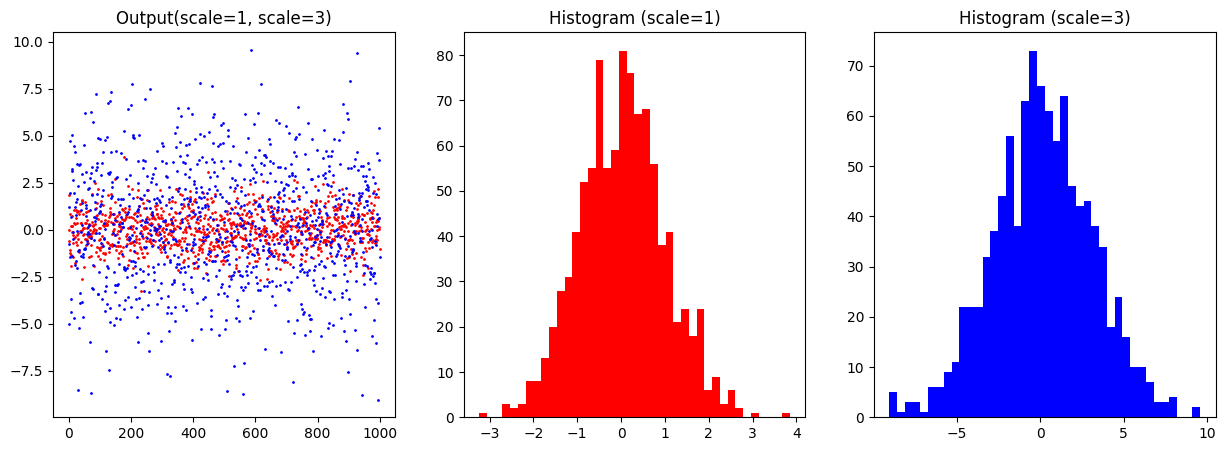
正規分布に従ったランダム配列を出力したい場合(np.random.normal)#
loc: 分布の平均値
scale: 標準偏差
size: 配列のshape
sample_1 = np.random.normal(loc=0, scale=1, size=1000)
sample_2 = np.random.normal(loc=0, scale=3, size=1000)

plt.figure(figsize=[15, 5])
plt.subplot(1, 3, 1)
plt.plot(sample_1, 'ro', markersize=1)
plt.plot(sample_2, 'bo', markersize=1)
plt.title('Output(scale=1, scale=3)')
plt.subplot(1, 3, 2), plt.hist(sample_1, bins=40, color='red'), plt.title('Histogram (scale=1)')
plt.subplot(1, 3, 3), plt.hist(sample_2, bins=40, color='blue'), plt.title('Histogram (scale=3)')
plt.show()